ERC B-WEX
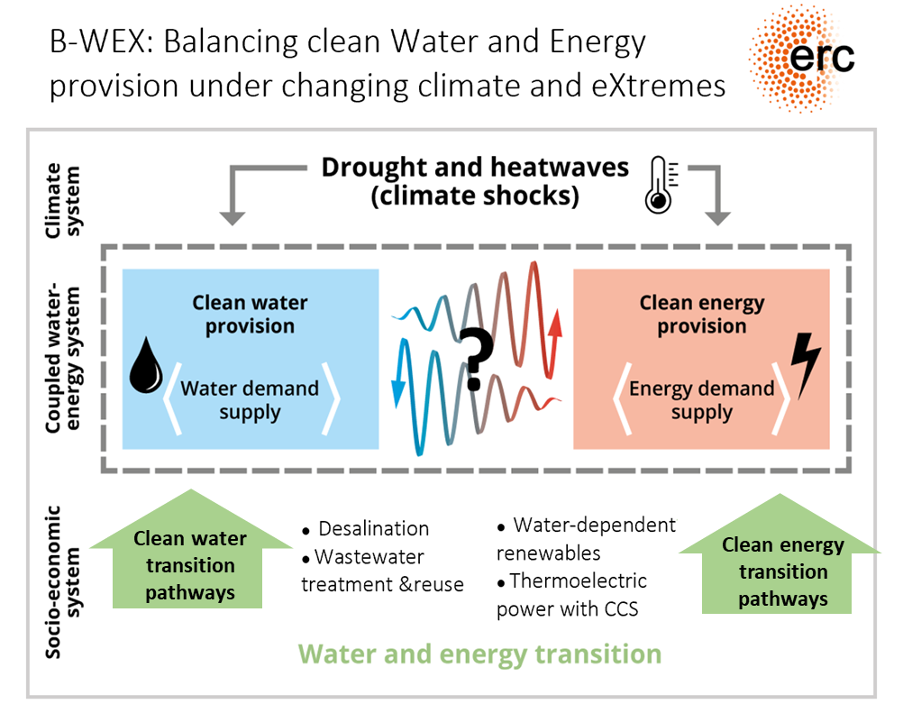
B-WEX project – Balancing clean Water and Energy provision under changing climate and eXtremes
Water and energy are intrinsically linked: we need energy to provide clean water (e.g. for wastewater treatment, desalination and pumping) and we need water to provide energy (e.g. for hydropower, cooling of thermo-electric power, concentrated solar power plants and biofuel production). Recent drought and heatwave events have shown the vulnerability of both the energy and water sectors, as the demand for the two and their systemic interdependencies are particularly strong. However, the interplay between clean water and energy under climate extremes is complex and poorly understood. With heatwaves and droughts occurring more frequently across the globe, we need improved understanding on how water–energy system processes cascade in time and space under a changing climate and changing extremes. This is urgently needed to develop water-management and energy-transition strategies that are also robust under increasing climate shocks. In the B-WEX Project, we develop spatially explicit pathways that reveal how the provision of clean water and energy can be balanced under various water-management and energy-transition developments, including the feedbacks and cascading mechanisms under present and future droughts and heatwaves in regions worldwide.
Key results
• A high-resolution model was developed for the major water treatment technologies to provide spatial estimates of global energy consumption for desalination, wastewater treatment, and conventional drinking water treatment.
• Water treatment accounts for 1.8–5.4 % of total global electricity consumption.
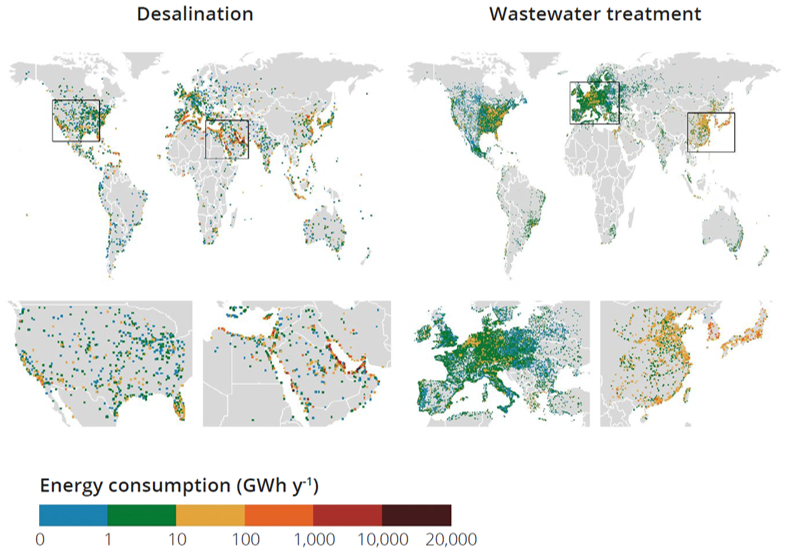
Spatial patterns in energy consumption use for desalination (left) and wastewater treatment (right) worldwide in 2015. Based on Magni et al. (2025)
A comprehensive, open-access global dataset has been developed that integrates hydropower plant and reservoir information. GLoHydroRes offers key attributes for hydropower plants (e.g., head, installed capacity) and detailed reservoir characteristics (e.g., dam/reservoir location, area, volume) including ~ 7,775 hydropower plants across 128 countries.
Global spatial distribution of hydropower plants, with color representing the hydropower plant type, i.e. run-of-river (ROR), storage (STO), pumped storage, (PS), Canal or not available (NA) included in the GloHydroRes dataset. The bubble size indicates the installed capacity of the hydropower plant. Based on Shah et al. (2025)